One model per SKU, chosen by what actually fits.
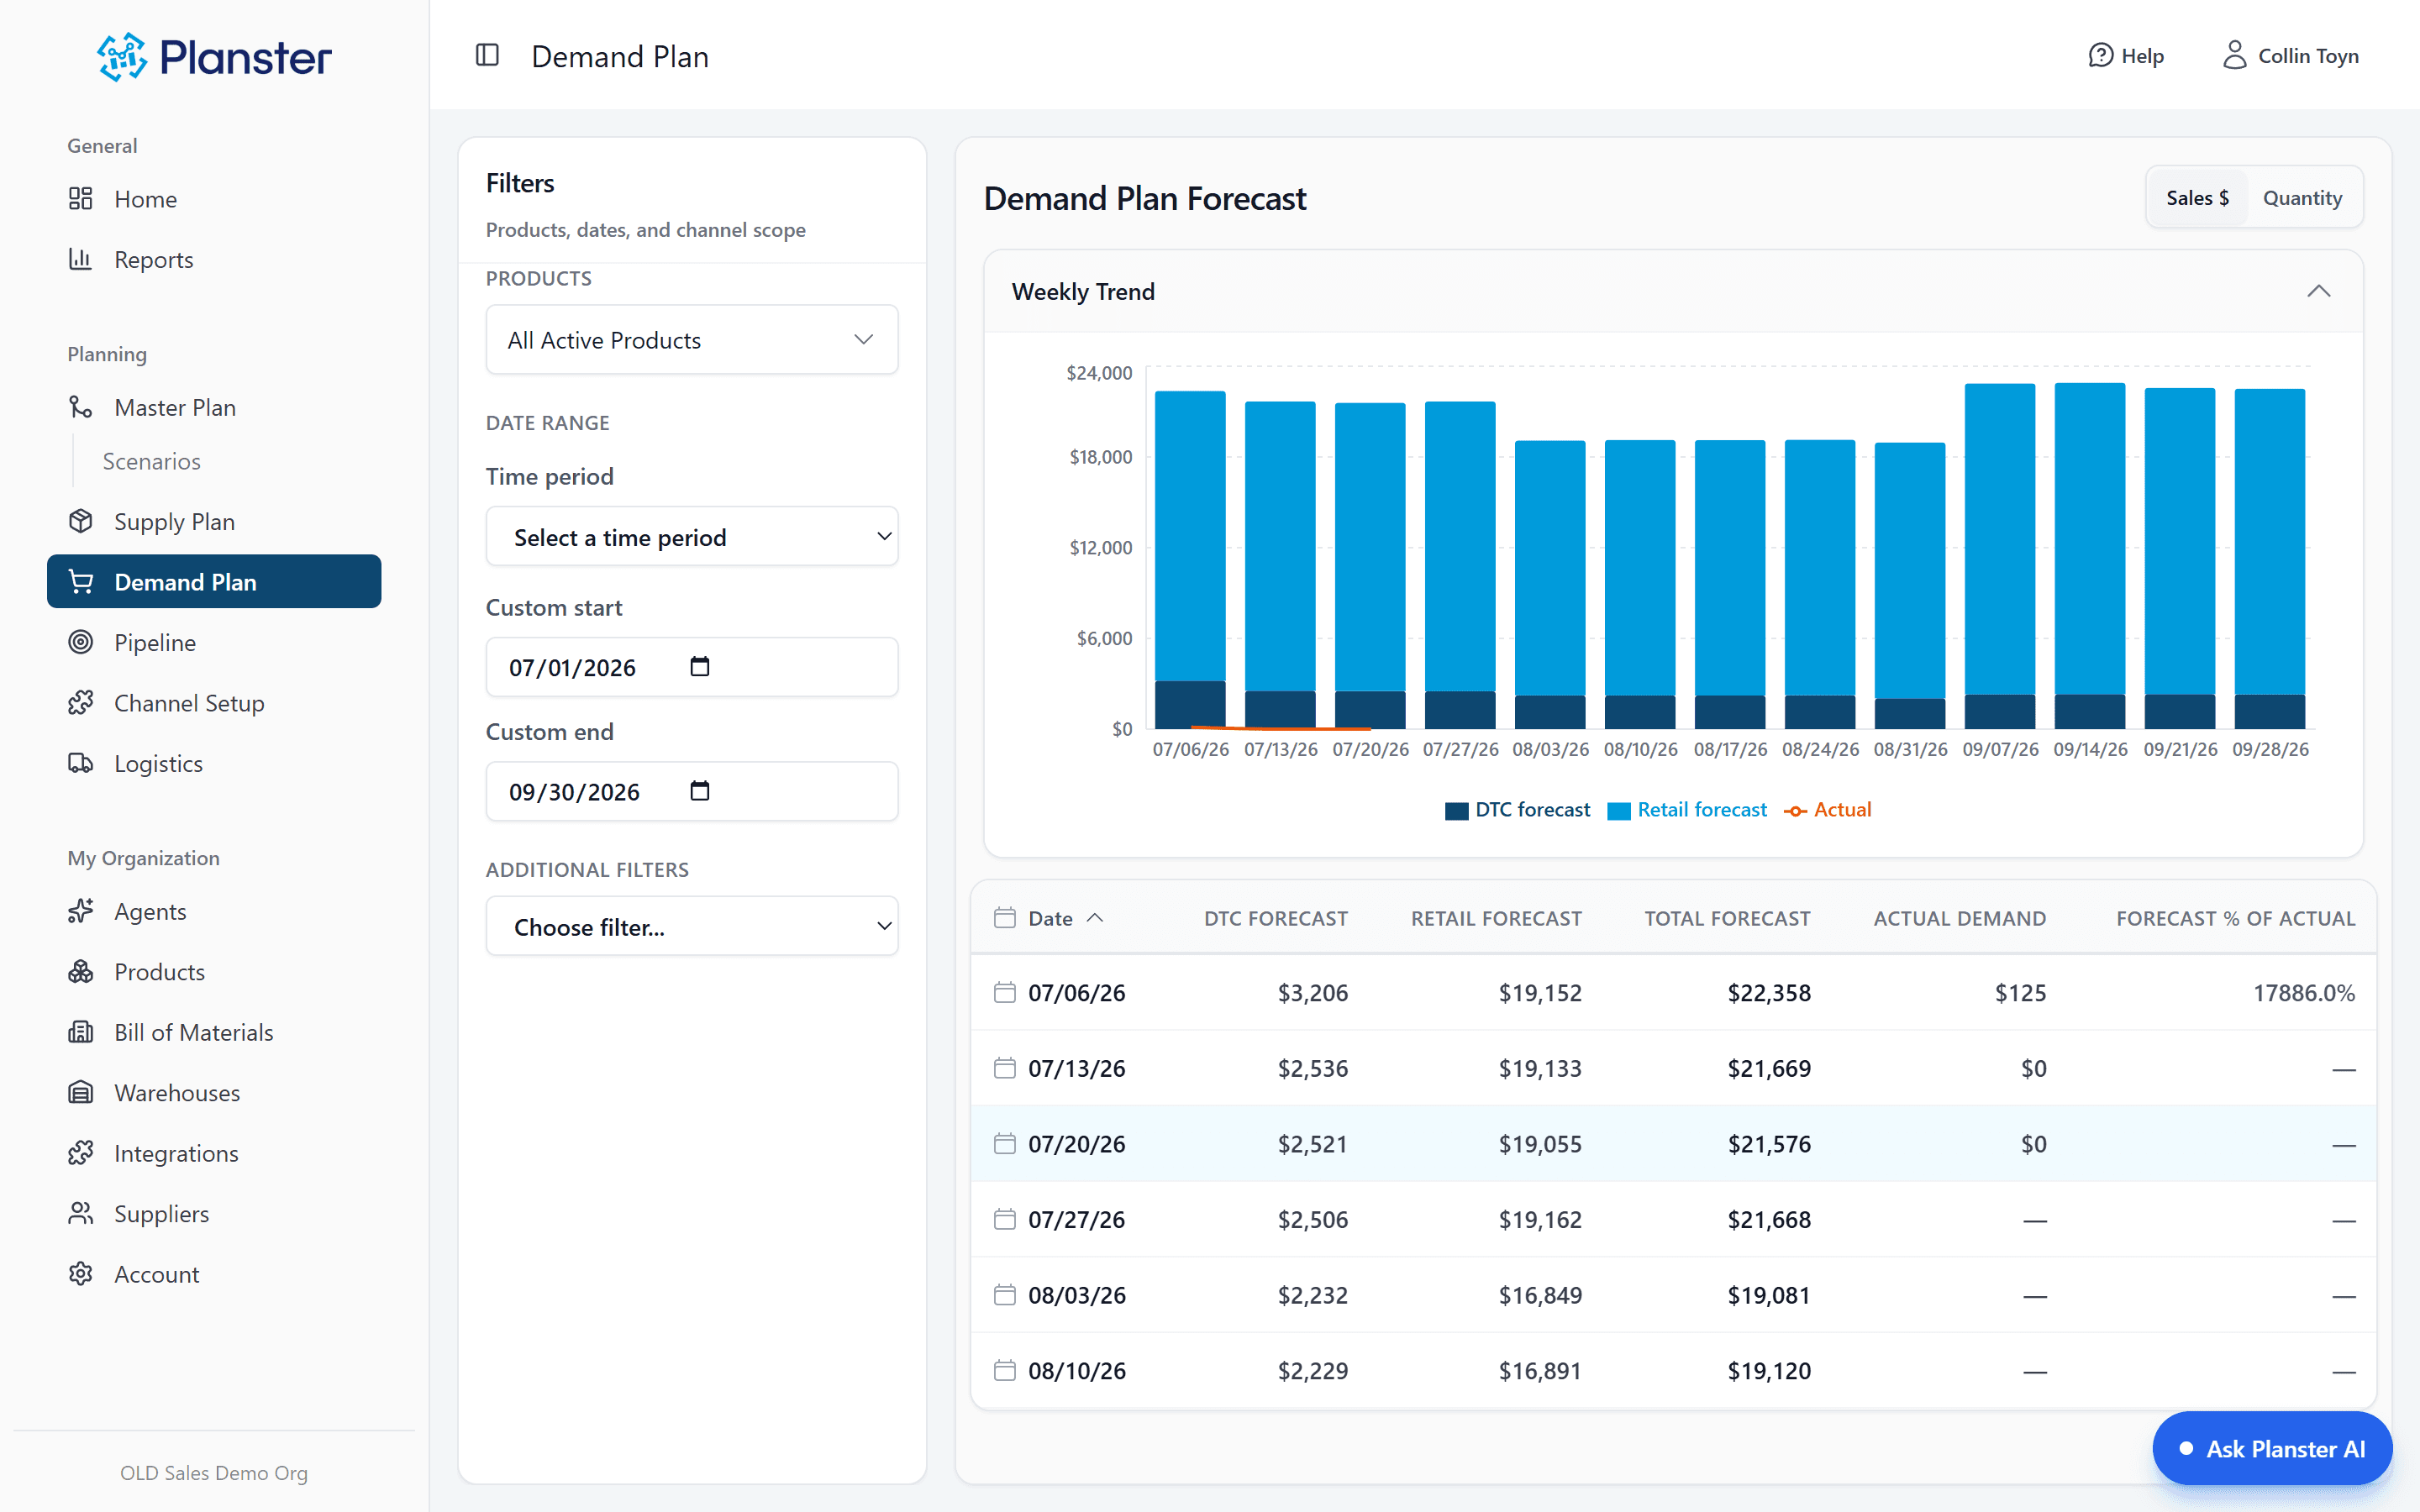
Planster fits Prophet, ETS, SARIMA, and linear regression to each SKU’s own history and keeps the one that predicts it best. When the pattern changes, it picks again. You do not choose a model, and you do not maintain one.
Four models, tested per SKU
Your best seller and the SKU you launched in March do not behave the same way, so they do not get the same model. Planster tests Prophet, ETS, SARIMA, and linear regression against each SKU’s own history and keeps the best fit. When the pattern changes, it re-picks. Nothing to tune.
It knows your seasonality
Seasonality is detected per product, not applied as one curve across the catalogue. Sunscreen and electrolyte mix peak in the same months for different reasons and at different shapes, and a forecast that averages them is wrong for both.
Stockout weeks do not teach it anything
A week you sold nothing because you had nothing is not a week of low demand. Planster excludes stockout periods and anomalies instead of learning from them, which is the single most common way a spreadsheet forecast talks itself into ordering less of the thing that keeps selling out.
Rolling, not rebuilt
The forecast runs 12 to 18 months out and re-generates on a schedule, so there is no quarterly exercise where someone rebuilds the model. It needs about a year of history — more than 52 weeks — before it can fit a seasonal pattern to a SKU.
What the agent does with demand forecasting
Every night
The agent re-checks every SKU against this forecast overnight, so a pattern that broke on Tuesday is on your list Wednesday morning rather than at the end of the month.
What it can’t do
It cannot change the forecast, override a model, or edit a cell. Model selection belongs to the engine, and hand edits belong to you.
The forecast that stopped arguing with itself
A supplements brand had one spreadsheet model applied to 240 SKUs: twelve-week trailing average, seasonality factor typed in by hand. It read the two months their hero SKU was out of stock as a demand collapse and cut the next order accordingly. Planster fits each SKU separately, drops the stockout weeks, and re-picks the model when the shape changes — so the SKU that sells out is the one it tells you to buy more of.
How it fits together
Every capability runs on the same demand forecast, so each one makes the others more useful.
Exceptions
Set a tolerance per SKU and get told when one runs outside it — while there is still lead time to do something about it.
Explore ExceptionsKnow what’s comingMulti-channel and multi-warehouse
The same forecast runs per channel: DTC, Amazon, retail, and wholesale planned separately, then combined.
Explore Multi-channelSee it fitted to your own SKUs
Connect your data and look at the forecast for the SKU you argue about most. Setup takes days, not months.